

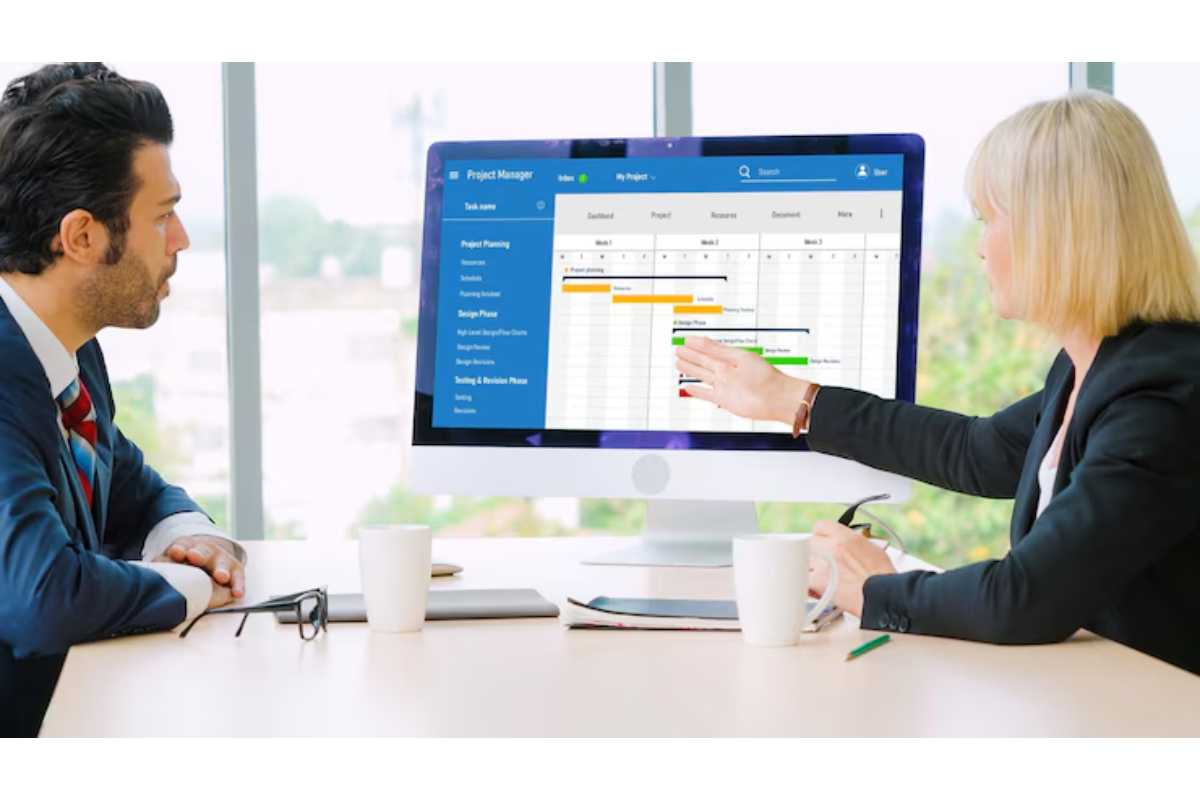
Types of Project Management Dashboard (With Examples & Use Cases)
Types of project management dashboard are a topic many people search, but most articles (like yours) mix tools with concepts, which creates confusion.
In this guide, I’ll explain:
- What a project dashboard actually is
- Different types (proper classification)
- Real examples
- When to use each
Project management dashboard: What is it?
It is an interactive tool that offers all the necessary information about the project, such as tasks, dates, budget, and other KPIs in one place.
The best description of it would be
A “control panel” for your project
It helps teams:
- Track progress
- Monitor KPIs
- Make faster decisions
Dashboards provide a real-time overview of project metrics and performance.
Why Project Dashboards Are Important
They help in:
- Better decision-making
- Real-time tracking
- Improved communication
- Resource management
Instead of checking multiple reports, everything is in one place
Main Types of Project Management Dashboard
Now let’s fix the biggest mistake and explain actual types (not tools)
1. Operational Dashboard
Operational dashboards become even more useful when teams need to understand which tasks could delay the entire project. Understanding the critical path in project scheduling helps project managers identify dependent activities, prioritize essential work, and monitor deadlines more effectively.
What it is:
Used for day-to-day project tracking
What it shows:
- Task progress
- Deadlines
- Team workload
Example:
A software team tracking:
- Daily tasks
- Sprint progress
Focus = real-time operations
2. Strategic Dashboard
What it is:
Used by managers and executives
What it shows:
- Long-term goals
- Project performance
- KPIs
Strategic dashboards focus on high-level insights and business outcomes
Example:
CEO tracking:
- Project success rate
- Revenue impact
3. Analytical Dashboard
Analytical dashboards are particularly valuable when businesses need to evaluate quality measurements and identify patterns in product defects. Understanding the impact of measurement accuracy on product quality helps teams recognize how precise measurements contribute to consistent production standards and fewer manufacturing errors.
What it is:
Used for deep data analysis
What it shows:
- Trends
- Historical data
- Performance comparisons
Example:
Analyzing:
- Why a project failed
- Cost trends
Helps in data-driven decisions
4. Project Status Dashboard
What it is:
Gives a quick overview of project health
What it shows:
- On-track / delayed
- Milestones
- Risks
Example:
A project manager checking:
- Which tasks are late
5. Resource Management Dashboard
Accurate workload planning becomes easier when managers understand how much time employees spend on different assignments. Using a time tracker for work helps teams monitor task durations, evaluate workloads, and identify opportunities to allocate resources more effectively.
What it is:
Focuses on team and resource allocation
What it shows:
- Workload
- Availability
- Productivity
Example:
Ensuring no employee is overloaded
Helps avoid burnout
6. Financial Dashboard
What it is:
Tracks budget and costs
What it shows:
- Budget vs actual
- Expenses
- Profit
Example:
Construction project tracking costs
7. Portfolio Dashboard
What it is:
Used for managing multiple projects
What it shows:
- All projects in one view
- Performance comparison
Example:
Company handling:
- 10+ projects at once
Focus = big picture
8. Risk Dashboard
What it is:
Tracks potential risks
What it shows:
- Risk level
- Impact
- Probability
Example:
IT project identifying:
- Security risks
9. Marketing Project Dashboard
What it is:
Used for marketing campaigns
What it shows:
- Campaign performance
- Leads
- Conversions
Example dashboards include marketing tracking systems
10. Agile / Sprint Dashboard
What it is:
Used in Agile projects
What it shows:
- Sprint progress
- Backlog
- Burndown charts
Example:
Scrum team tracking sprint tasks
Types vs Tools (Important Clarification)
This is where your article went wrong.
Wrong:
- Basecamp = dashboard type
- Harvest = dashboard type
Correct:
These are tools/software used to CREATE dashboards.
Examples of Dashboard Tools (Not Types)
- Asana
- Trello
- Monday.com
- ClickUp
These tools can create multiple dashboard types
What a Good Dashboard Includes
For manufacturing projects, dashboards can also support production planning by helping managers monitor resources, schedules, and operational requirements. Understanding the preliminary stage of production planning helps businesses organize production activities, estimate resource needs, and establish priorities before manufacturing begins.
A proper dashboard should show:
- Tasks & deadlines
- KPIs
- Budget
- Resource allocation
- Risks
Dashboards combine metrics, charts, and data visualization for quick insights
Real-Life Example of Dashboard Usage
Let’s say you run a digital marketing agency.
You might use:
- Operational dashboard → daily tasks
- Marketing dashboard → campaign tracking
- Financial dashboard → budget tracking
All dashboards serve different purposes
Benefits of Project Dashboards
A well-designed dashboard can also help teams manage their time by highlighting priorities, upcoming deadlines, and tasks that need attention. Applying effective time management and productivity strategies alongside dashboard reporting helps employees organize workloads, reduce distractions, and complete important tasks more efficiently.
- Real-time visibility
- Better team coordination
- Faster decisions
- Improved productivity
Common Mistakes to Avoid
- Mixing tools with types
- Adding too many metrics
- No clear purpose
- Poor design
Types of Dashboard (Quick Comparison)
| Dashboard Type | Purpose | Used By |
|---|---|---|
| Operational | Daily tracking | Teams |
| Strategic | Long-term goals | Executives |
| Analytical | Data analysis | Analysts |
| Status | Project health | Managers |
| Resource | Team workload | HR/Managers |
| Financial | Budget tracking | Finance teams |
Tips to Choose the Right Dashboard
Choosing the right dashboard is only the first step toward better project performance. Following practical tips to improve project management can help teams set clear responsibilities, manage risks, improve communication, and use dashboard insights to keep projects on track.
- Define your goal first
- Don’t overload data
- Focus on key metrics
Conclusion
Types of project management dashboard should be clearly understood—not confused with tools.
Once you understand the difference:
- You can choose the right dashboard
- Improve project efficiency
- Make smarter decisions